Sebastian H. Mernild
PH.D. & D.SC., Professor in Climate change and glaciology and head of SDU Climate Cluster
Perspective
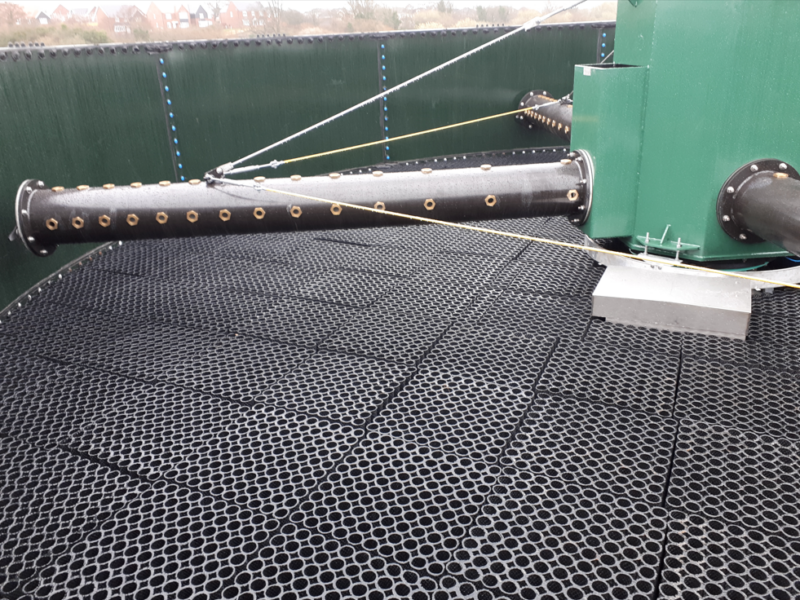
Urban water management
Water management

PH.D. & D.SC., Professor in Climate change and glaciology and head of SDU Climate Cluster
Observed warming is driven by emissions from human activities. Stated by IPCC (Intergovernmental Panel on Climate Change), it is unequivocal that human influence has warmed the atmosphere, ocean, and land. Widespread and rapid changes in the atmosphere, ocean, and biosphere have occurred.
Each of the last four decades has been successively warmer than any decade that preceded it since 1850, where the global surface temperature was 1.09°C higher in 2011–2020 than 1850–1900, with larger increases over land than over the ocean. The temperature has increased faster since 1970 than in any other 50-year period over at least the last 2000 years. Temperatures during the most recent decade exceed those of the most recent multi-century arm period, around 6,500 years ago.
Also, the globally averaged precipitation over land has likely increased since 1950, with a faster rate of increase since the 1980s. The frequency and intensity of heavy precipitation events have increased since the 1950s over most land area for which observational data are sufficient for trend analysis. It is likely that human influence contributed to the pattern of observed precipitation changes since the mid-20th century.
Many changes in the climate system become larger in direct relation to increasing global warming. They include increases in the frequency and intensity of hot extremes, marine heatwaves, heavy precipitation, and, in some regions, agricultural and ecological droughts. With every additional increment of global warming, changes in extremes continue to become larger. For example, every additional 0.5°C of global warming causes clearly discernible increases in the intensity and frequency of hot extremes, including heatwaves, and heavy precipitation.
When it comes to a climate-related challenges – e.g., sea-level changes – the global mean sea level changes have increased by 0.20 m between 1901 and 2018, covering significant regional variations. The average rate of sea level rise was 1.3 mm per year between 1901 and 1971 increasing to 3.7 mm per year between 2006 and 2018. Human influence was very likely the main driver of the increases since at least 1971. Stated by IPCC, we except that the global mean sea level will continue to rise over the 21st century: and over the next 2000 years, global mean sea level will rise by about 2 to 3 meters if warming is limited to 1.5°C and 2 to 6 meters if limited to 2°C.
The scale of recent changes across the climate system as a whole and the present state of many aspects of the climate system are unprecedented over many centuries to many thousands of years. Further, the climate system is today in a situation, where the atmospheric CO2 concentrations is higher than at any time in at least 2 million years, and concentrations of CH4 (Methane) and N2O (Nitrous oxide) is higher than at any time in at least 800,000 years. We are facing a global challenge when it comes to human influence on the climate system. The average annual greenhouse gas emissions during 2010–2019 were higher than in any previous decade, but the rate of growth between 2010 and 2019 was lower than that between 2000 and 2009. The fact that the rate of growth has fallen on average over the past decade can be interpreted as one flimsy and initial sign that the green transition – in a global perspective – is showing its incipient effect.

Partner news
Water management
+1

Perspective
Job creation and just transition
+2